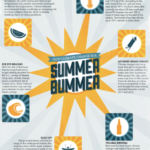
The Huffington Post published this infographic describing how global climate change is making summer a bummer. It describes how many favorite summer eats like watermelon could become scarce as climate change affects the honeybee population. It points out the consequences of coastal erosion, which could make days at the beach a thing of the past. The infographic then explains … [Read more...]
Interesting content about the environment. This category includes environmentalism relating to land, sea, and everything in between.
Go Vegan for Earth Day
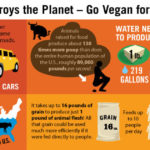
With the slew of environmental perils facing the world today, it’s no wonder people everywhere are looking for ways to live a little more eco-friendly. And there are plenty of ways to do so, whether it’s using solar energy, conserving water, or changing your diet. This infographic explains the ecological benefits of eating a vegan diet and encourages readers to go vegan for … [Read more...]
Humming Bird Facts

Hummingbirds are some of the quickest birds on the planet. They’re also some of the most beautiful. These spritely avians are found throughout South, Central, and North America, from Alaska to Chile. This infographic outlines some interesting facts about hummingbirds. It discusses the bird’s body composition, with curious facts about its brain size, feathers, tongue, and feet. … [Read more...]
World Mortality Causes/Rates in 2016 vs. 2015
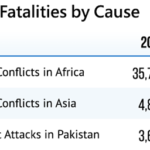
Many people regard 2016 as one of the worst years in recent memory. Indeed, it seemed terrorist attacks, shootings, plane crashes, and other tragedies dominated the headlines on a daily basis. But according to this infographic, created by Knoema, the year 2016 may actually have been safer in 2016 than in 2015, with one notable exception. The date shows the frequency of some … [Read more...]
Feel the Power: Shocking Facts About Electricity Usage in the United States
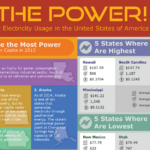
The United States is one of the top nations in the world when it comes to energy consumption. Home Advisor made this infographic to illustrate how residents of the U.S. use all of that power. It includes data such as which seven states use the most power; which five states have the highest average energy bills; and which five states have the lowest average energy bills. It also … [Read more...]