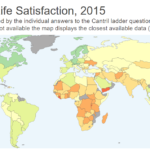
Everyone wonders, from time to time, if there’s somewhere else in the world where the proverbial grass is really greener. The World Happiness Report created this infographic to give us a better perspective of how happy people are in different regions of the globe. People in numerous countries were given a survey in which they were asked to rate their happiness from 0 to 10. … [Read more...]
Archives for March 2017
The Most Popular Long Queries on Google in 2016

You could learn quite a bit about a person from their Internet search history. This infographic by SerpStat illustrates the most popular long search queries typed into Google. These are queries in the form of a complete question. Some examples are: “how many ounces in a gallon” or “how many feet in a mile.” According to the infographic, measurements are quite a popular search … [Read more...]
Construction Crane Maps by City
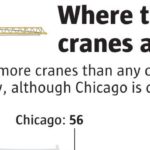
Mark Nowlin of the Seattle Times crafted this infographic based on data from the RLB Crane Index. It illustrates which cities have the most construction cranes. Per the infographic, Seattle had the most cranes with 62 as of January. Chicago was a close second with 56 cranes. Other cities listed on the map include Washington D.C., Boston, New York, Austin, Denver, Phoenix, Los … [Read more...]
The Biggest Blunders in History

To err is human---celebrities, business moguls, and politicians all make mistakes. This infographic illustrates some of the biggest blunders in human history. It includes three sections, one for “celebrity snafus,” another for “business blunders,” and a third for “historical hiccups.” The timeline for this infographic stretches all the way back to Julius Caesar’s death in 44BC … [Read more...]
Tech Predictions for 2017

Technology is advancing quicker than ever before. Each year, millions of people eagerly anticipate the release of the next best thing from their favorite company, whether it’s the latest iPhone or a new XBox. This infographic made by Prolific Idea sets out to predict the future of tech for the year 2017. The infographic illustrates predictions for various sects of technology, … [Read more...]