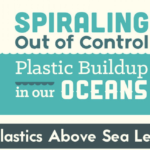
Custom Made, in partnership with Ghergich & Co., created this infographic entitled “Spiraling Out of Control: Plastic Buildup in Our Oceans.” First, the graphic discusses the prevalence of plastics above sea level. It shares data like the amount of oil consumed in the production of plastic, and how much plastic manufacturing and consumption has increased over the past 100 … [Read more...]
Archives for March 2018
15 signs that you might be an alcoholic

Alcoholism is a severe, often life-threatening, disease that affects all socio-demographics. If left untreated, it can cause serious damage to you and those around you. This infographic can help identify different signs on whether or not someone may be an alcoholic. Identifying an Issue is the first step to bettering the problem. Alcoholism has become such a common disorder … [Read more...]
Fighting Opioid Addiction with CBD Oil
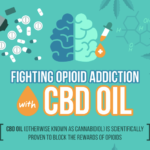
CBD Oil (otherwise known as cannabidiol) is scientifically proven to block the rewards of opioids and help with the fight against opioid addiction. CBD oil is a safe and natural botanical supplement. Although CBD is primarily found in the resin glands of the fine hairs of cannabis’ female flower buds, CBD is non-psychoactive. This means that CBD oil offers the medicinal … [Read more...]
Where Have the Tigers Gone?
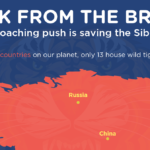
This colorful infographic explains how anti-poaching laws saved Siberian Tigers from extinction. The infographic begins by stating that only 13 of the world’s 195 countries are home to Siberian Tigers. It then shows a map of the area where these animals live. Next, there is data detailing the tiger’s rapid decline. It then explains the cause of the decline. The graphic then … [Read more...]
Exploring New York’s Burroughs
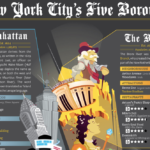
Though they’re all a part of the same city, each of New York’s five boroughs has its own distinct attractions and personality. Marriott International, one of the world’s largest hospitality companies, made this lively infographic illustrating each of the NYC boroughs. These include Manhattan, The Bronx, Staten Island, Brooklyn, and Queens. The infographic explains the etymology … [Read more...]