Content Geek

A collection of content

  • Fashion
  • Lifestyle
  • Politics
  • Technology
  • Travel
  • Submit an Infographic!

Average Commute to Work by State and City

May 1, 2018 By Content Geek

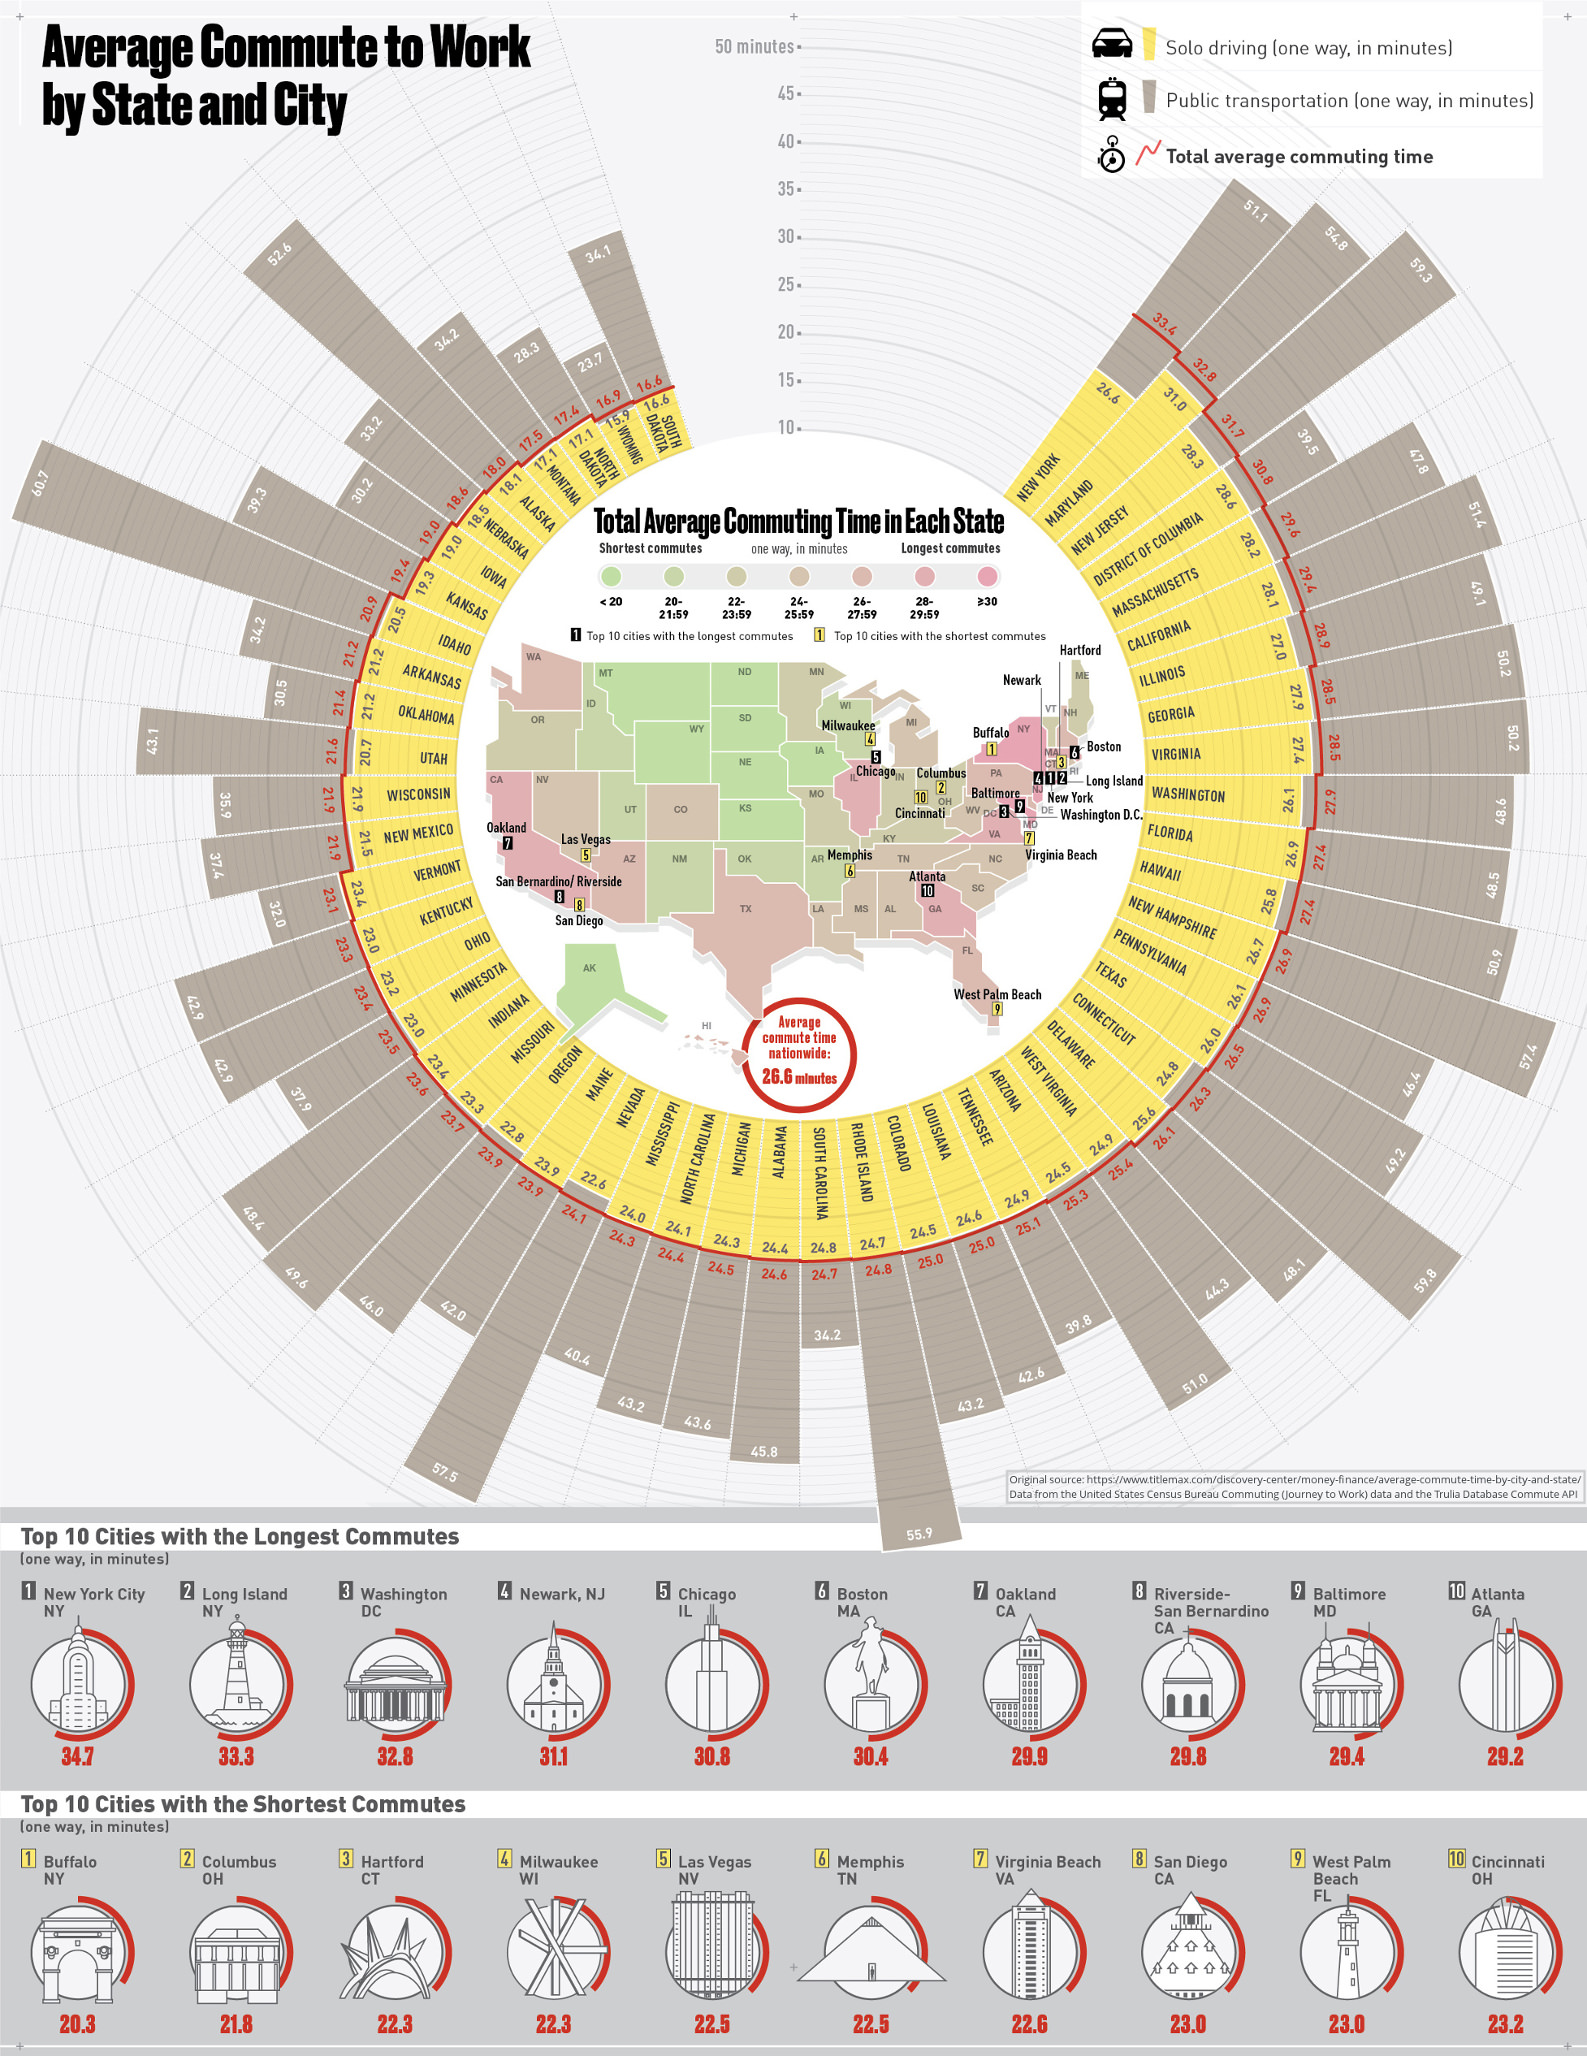
Other than those who telecommute, most people commute to and from work several days per week. Depending on your transportation method, distance from home to work, and the city you live in, your commute time may range from a few minutes to a couple of hours. This infographic is titled “Average Commute to Work by State and City.” It illustrates the average time it takes residents of certain states and cities to get to work each day. It shows the average time it takes to drive solo, one-way, in minutes, as well as the average time it takes to take public transportation one-way, in minutes, in addition to the average overall commute time. There’s data for each of the 50 states, with a color-coded map of the U.S. to show which states have the best and worst commute times. The infographic also provides data for the 10 cities with the shortest commutes, and the 10 with the longest.

Filed Under: Career & Jobs

Email Newsletter

  • Pinterest
  • Twitter

Fashion

The Evolution of Men’s Workwear

March 13, 2018 By Content Geek

What You May Not Know About Plus Sizes

February 6, 2018 By Content Geek

Ultimate ‘80s — How to Recreate Your Favorite Retro Style

January 4, 2018 By Content Geek

Categories

  • Animated
  • Artist
  • Beauty
  • Business
  • Career & Jobs
  • Charity
  • Country
  • Design
  • Education
  • Entertainment Industry
  • Environmental
  • Fashion
  • Finance & Money
  • Food & Drink
  • Games
  • Health
  • Hero
  • Historical
  • Holiday
  • Home & Garden
  • Interactive
  • Internet
  • Language
  • Law and Legal
  • Lifestyle
  • Offbeat
  • Parenting
  • Pets & Animals
  • Political
  • Politics
  • Religion
  • Science
  • Shopping
  • Sports and Athletic
  • Technology
  • Time
  • Tradition
  • Transportation
  • Travel
  • Uncategorized

About Content Geek

Content Geek is devoted to sharing beautiful data. We love interesting facts, weird information, and unique visualizations. Think you have an infographic to share? Submit here for review.

Recent

  • The Plot of MacBeth Visualized
  • Top 10 Holiday Destinations
  • Deadliest Pandemics
  • How to Survive Customer Service During the Holidays

Search

Copyright © 2025 · ContentGeek.com · Log in