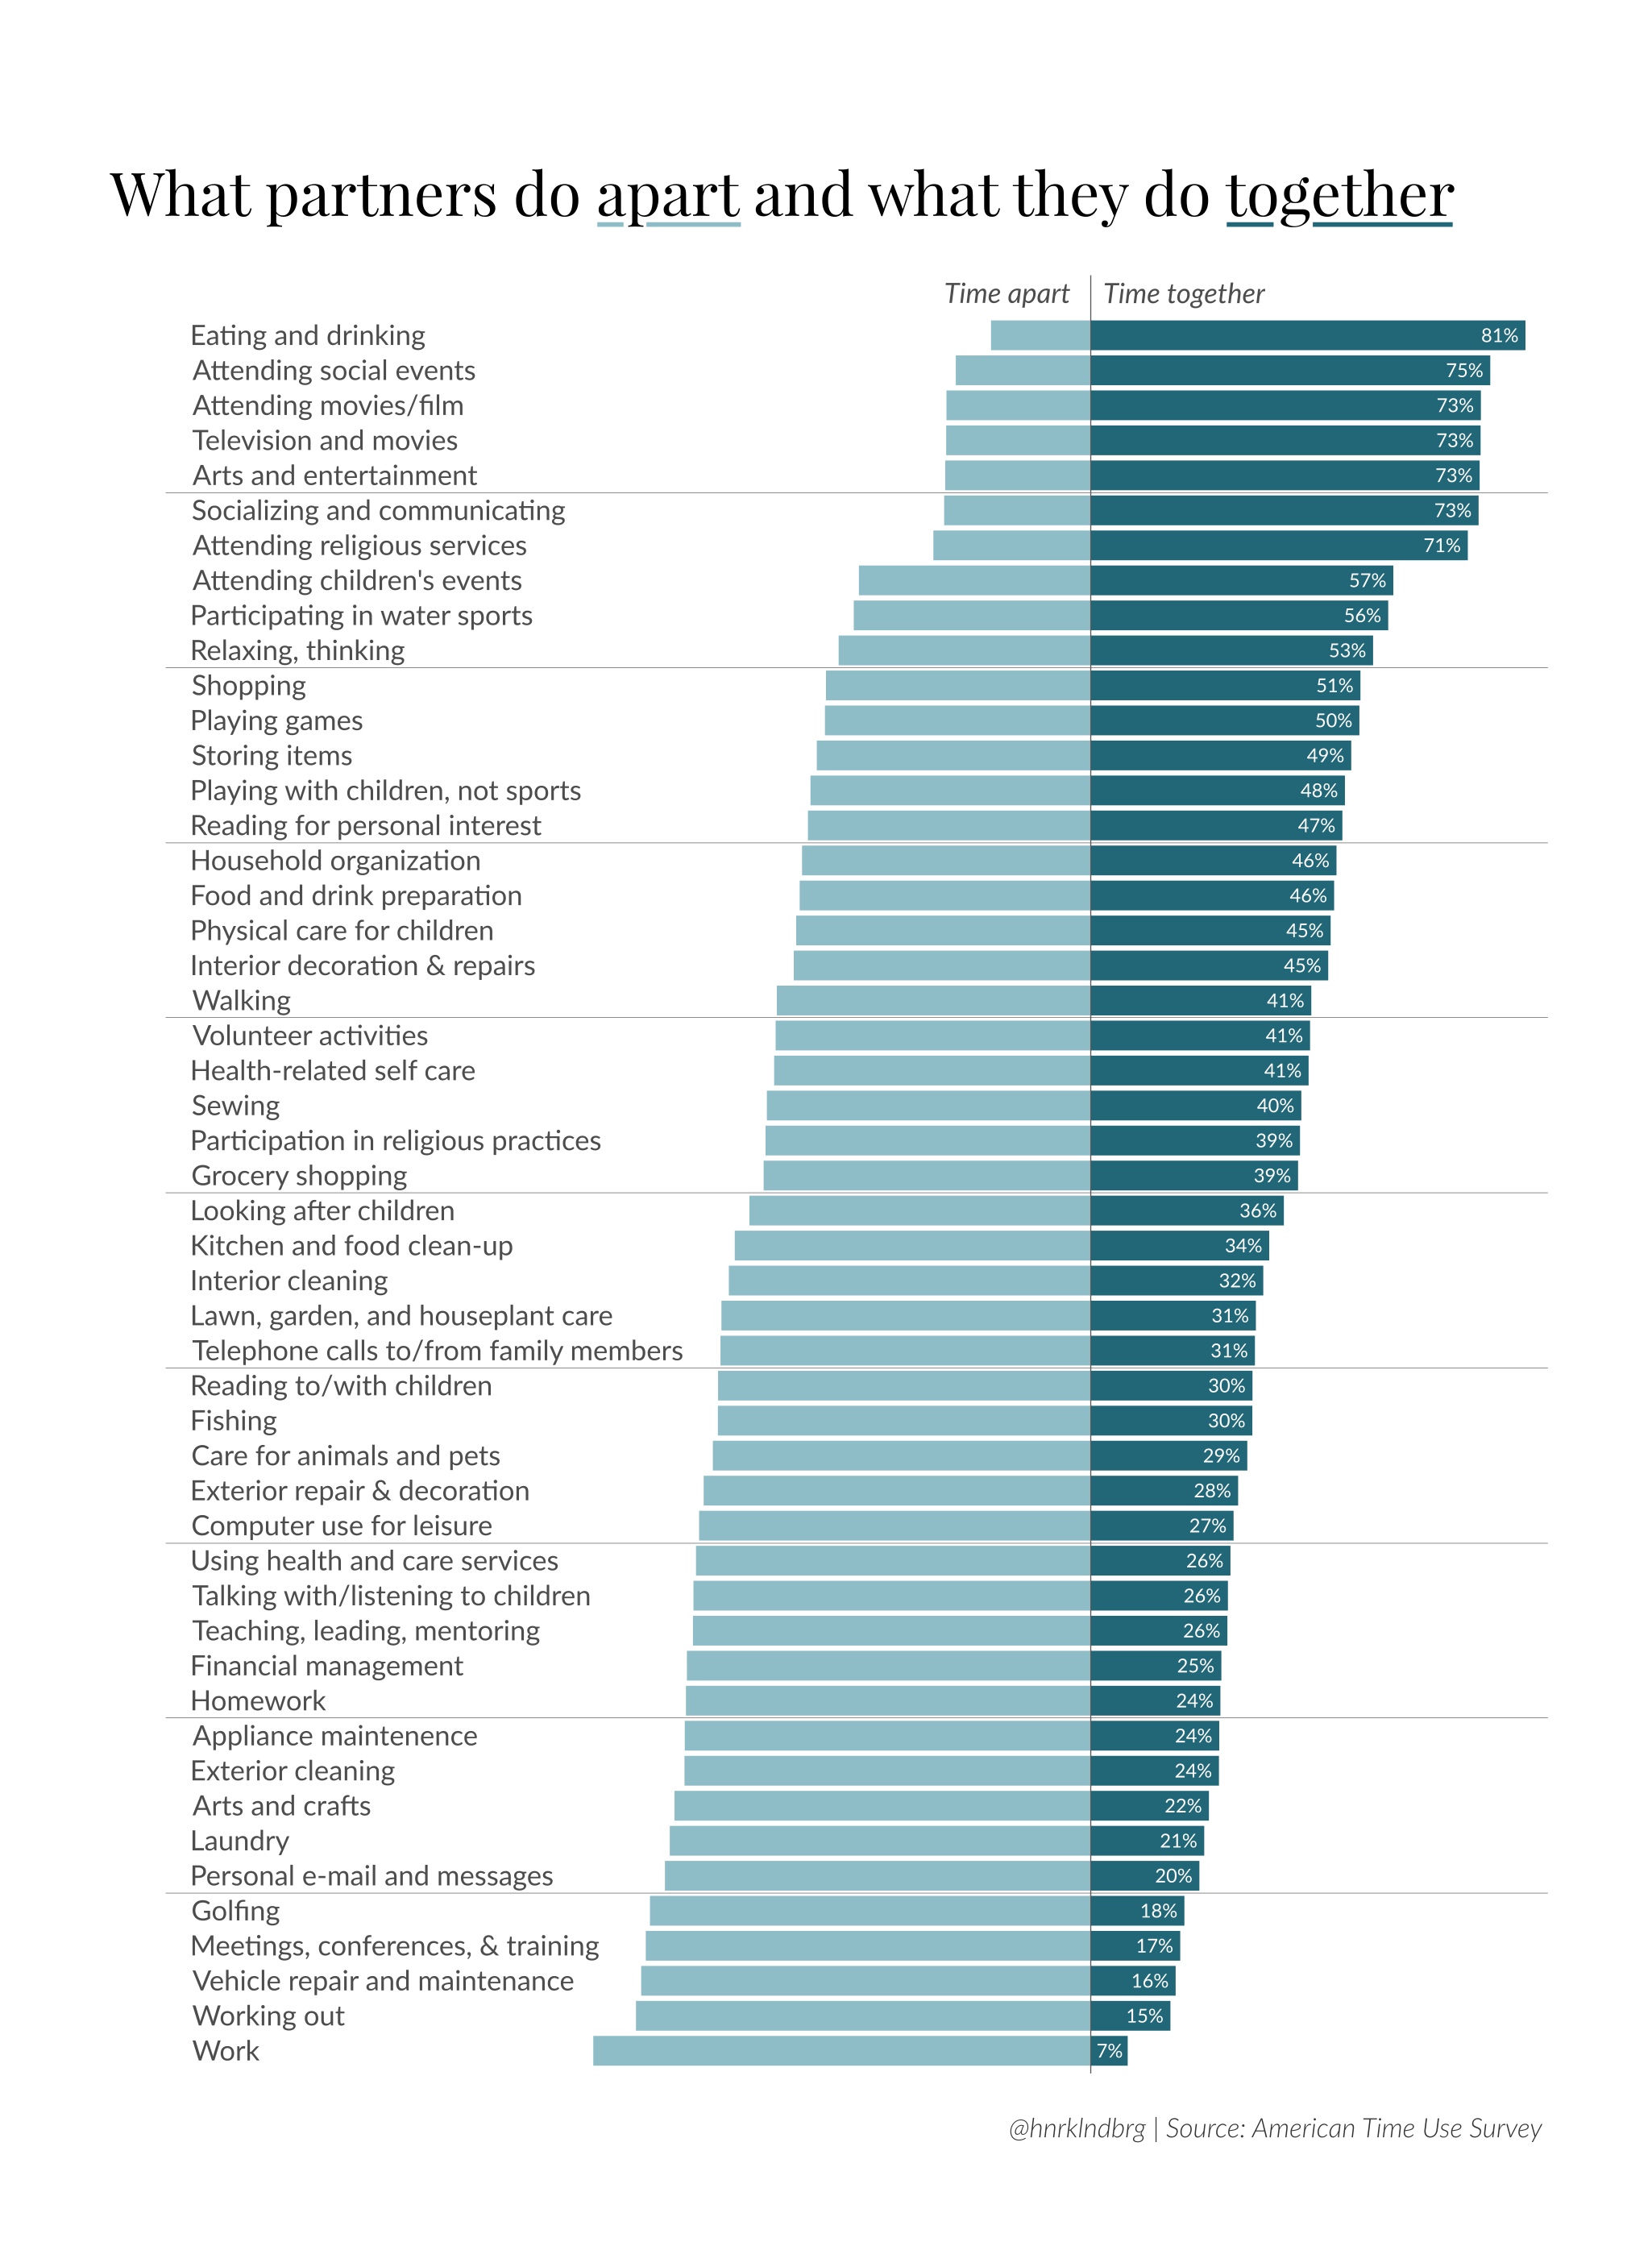
This infographic illustrates what couples do when alone vs. what they do with their partner. The graphic is based on data from the American Time Use Survey. At the top of the graphic, you’ll find activities couples most often do together. For example, 81% of respondents said they eat and drink together; 75% said they attend social events together; and 73% said they go to movies as a couple. The infographic lists a variety of different activities in descending order, from those couples most often do together to those they most often do apart.
