Content Geek

A collection of content

  • Fashion
  • Lifestyle
  • Politics
  • Technology
  • Travel
  • Submit an Infographic!

Facts on Marijuana Use

November 23, 2017 By Content Geek Leave a Comment

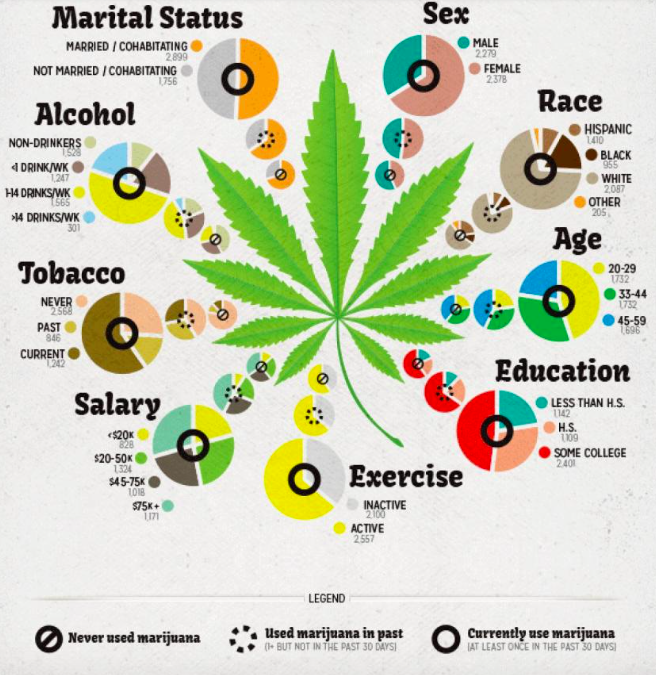
Though marijuana use is still considered taboo to many people, several states and countries have declared it legal for medical and recreational use. This infographic, created by the Philly Voice, shares some statistics on marijuana use. As the key specifies, each statistic is divided into three separate sectors: those who currently use marijuana, those who have used it in the past, and those who’ve never used it. It’s also divided into subjects and populations. For example, there’s information regarding people who’re married/cohabitating and people who’re not married/cohabitating; people’s level of education relative to marijuana use; and people’s activity levels. There’s also statistics based on race, gender, age, and salary level, as well as alcohol and tobacco use.

Filed Under: Health

Leave a Reply Cancel reply

Your email address will not be published. Required fields are marked *

Email Newsletter

  • Pinterest
  • Twitter

Fashion

The Evolution of Men’s Workwear

March 13, 2018 By Content Geek Leave a Comment

What You May Not Know About Plus Sizes

February 6, 2018 By Content Geek Leave a Comment

Ultimate ‘80s — How to Recreate Your Favorite Retro Style

January 4, 2018 By Content Geek Leave a Comment

Categories

  • Animated
  • Artist
  • Beauty
  • Business
  • Career & Jobs
  • Charity
  • Country
  • Design
  • Education
  • Entertainment Industry
  • Environmental
  • Fashion
  • Finance & Money
  • Food & Drink
  • Games
  • Health
  • Hero
  • Historical
  • Holiday
  • Home & Garden
  • Interactive
  • Internet
  • Language
  • Law and Legal
  • Lifestyle
  • Offbeat
  • Parenting
  • Pets & Animals
  • Political
  • Politics
  • Religion
  • Science
  • Shopping
  • Sports and Athletic
  • Technology
  • Time
  • Tradition
  • Transportation
  • Travel
  • Uncategorized

About Content Geek

Content Geek is devoted to sharing beautiful data. We love interesting facts, weird information, and unique visualizations. Think you have an infographic to share? Submit here for review.

Recent

  • The Plot of MacBeth Visualized
  • Top 10 Holiday Destinations
  • Deadliest Pandemics
  • How to Survive Customer Service During the Holidays

Search

Copyright © 2023 · ContentGeek.com · Log in