Content Geek

A collection of content

  • Fashion
  • Lifestyle
  • Politics
  • Technology
  • Travel
  • Submit an Infographic!

Fourth of July by the Numbers

December 20, 2017 By Content Geek Leave a Comment

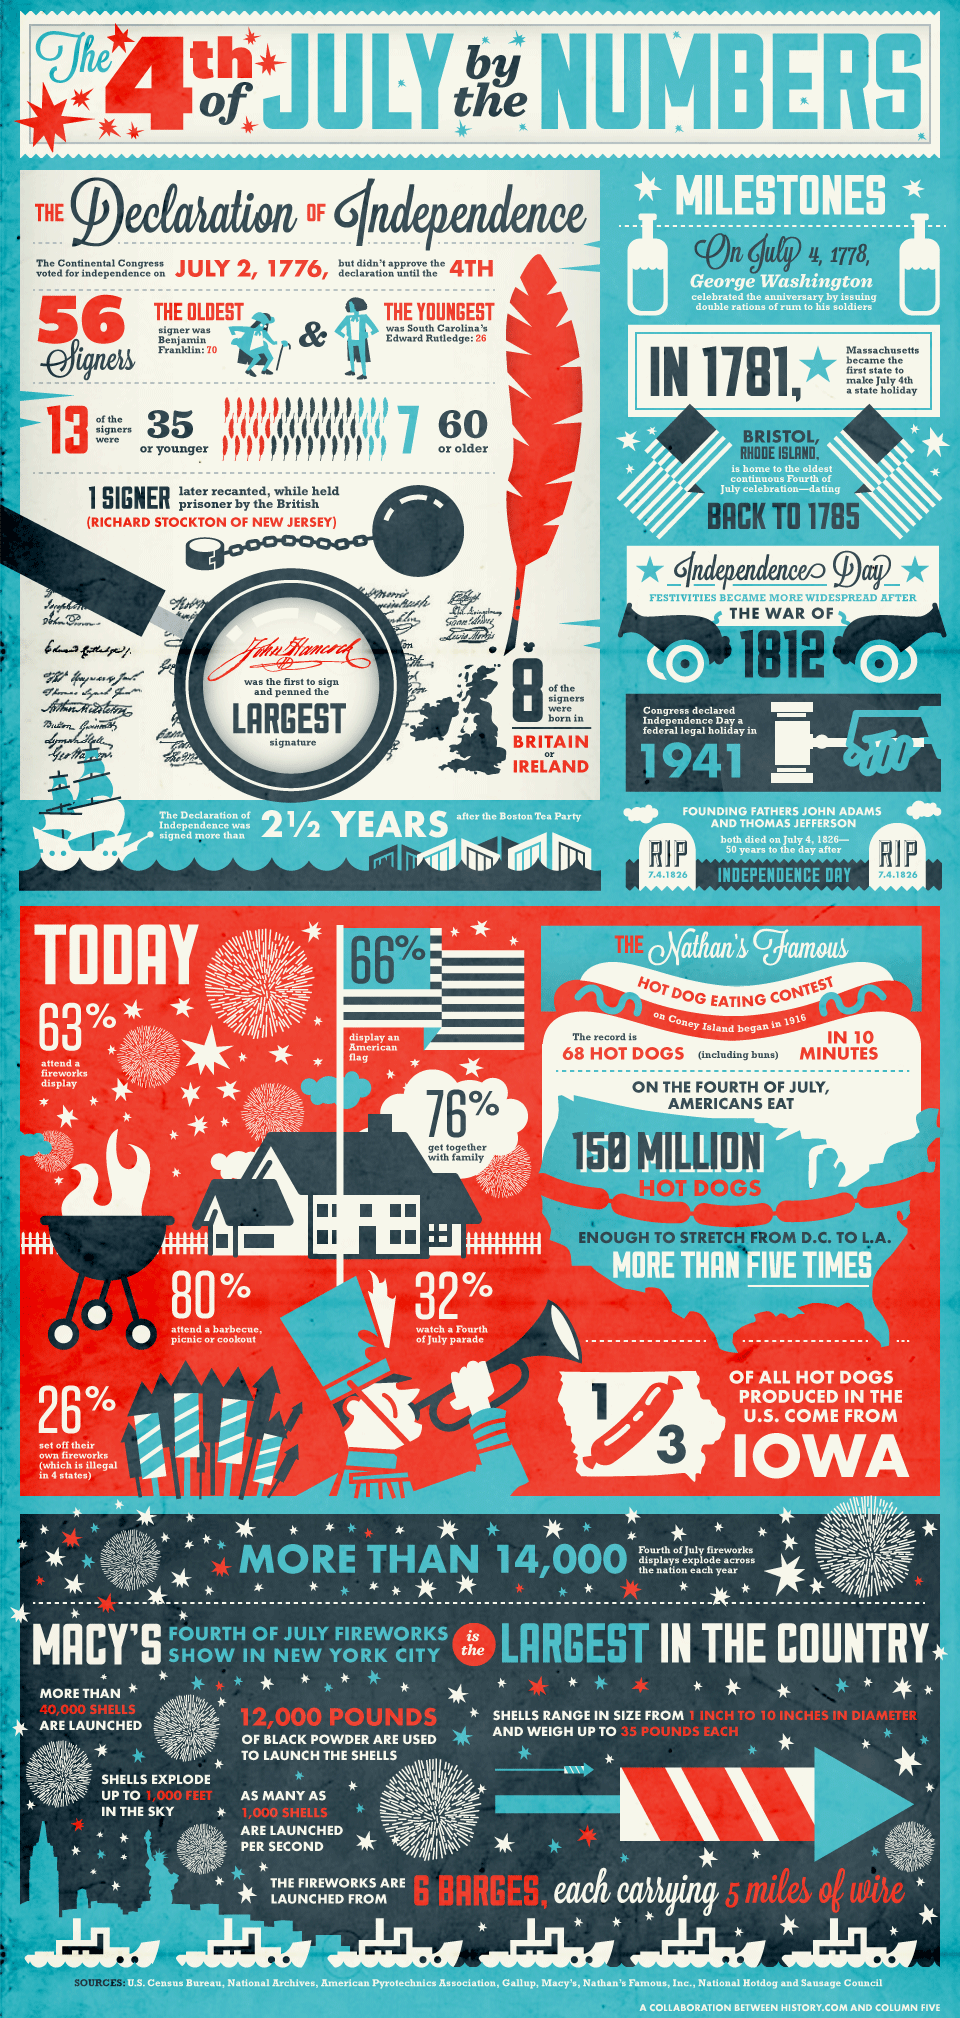
Column Five and History.com collaborated to create this infographic entitled “The 4th of July by the Numbers.” The graphic illustrates several interesting facts about America’s Independence Day. It begins by describing its origins and the Declaration of Independence and goes on to outline historical milestones related to the holiday. In these portions, you’ll find out things like who was the oldest person to sign the Declaration of Independence and how one person later recanted his declaration. The second half of the graphic describes present-day Independence Day. Here, you’ll find a slew of statistics and fun facts like how many people attend fireworks displays and what state is the biggest consumer of hot dogs.

Filed Under: Holiday

Leave a Reply Cancel reply

Your email address will not be published. Required fields are marked *

Email Newsletter

  • Pinterest
  • Twitter

Fashion

The Evolution of Men’s Workwear

March 13, 2018 By Content Geek Leave a Comment

What You May Not Know About Plus Sizes

February 6, 2018 By Content Geek Leave a Comment

Ultimate ‘80s — How to Recreate Your Favorite Retro Style

January 4, 2018 By Content Geek Leave a Comment

Categories

  • Animated
  • Artist
  • Beauty
  • Business
  • Career & Jobs
  • Charity
  • Country
  • Design
  • Education
  • Entertainment Industry
  • Environmental
  • Fashion
  • Finance & Money
  • Food & Drink
  • Games
  • Health
  • Hero
  • Historical
  • Holiday
  • Home & Garden
  • Interactive
  • Internet
  • Language
  • Law and Legal
  • Lifestyle
  • Offbeat
  • Parenting
  • Pets & Animals
  • Political
  • Politics
  • Religion
  • Science
  • Shopping
  • Sports and Athletic
  • Technology
  • Time
  • Tradition
  • Transportation
  • Travel
  • Uncategorized

About Content Geek

Content Geek is devoted to sharing beautiful data. We love interesting facts, weird information, and unique visualizations. Think you have an infographic to share? Submit here for review.

Recent

  • The Plot of MacBeth Visualized
  • Top 10 Holiday Destinations
  • Deadliest Pandemics
  • How to Survive Customer Service During the Holidays

Search

Copyright © 2023 · ContentGeek.com · Log in