Content Geek

A collection of content

  • Fashion
  • Lifestyle
  • Politics
  • Technology
  • Travel
  • Submit an Infographic!

Halloween by the Numbers

November 6, 2018 By Content Geek Leave a Comment

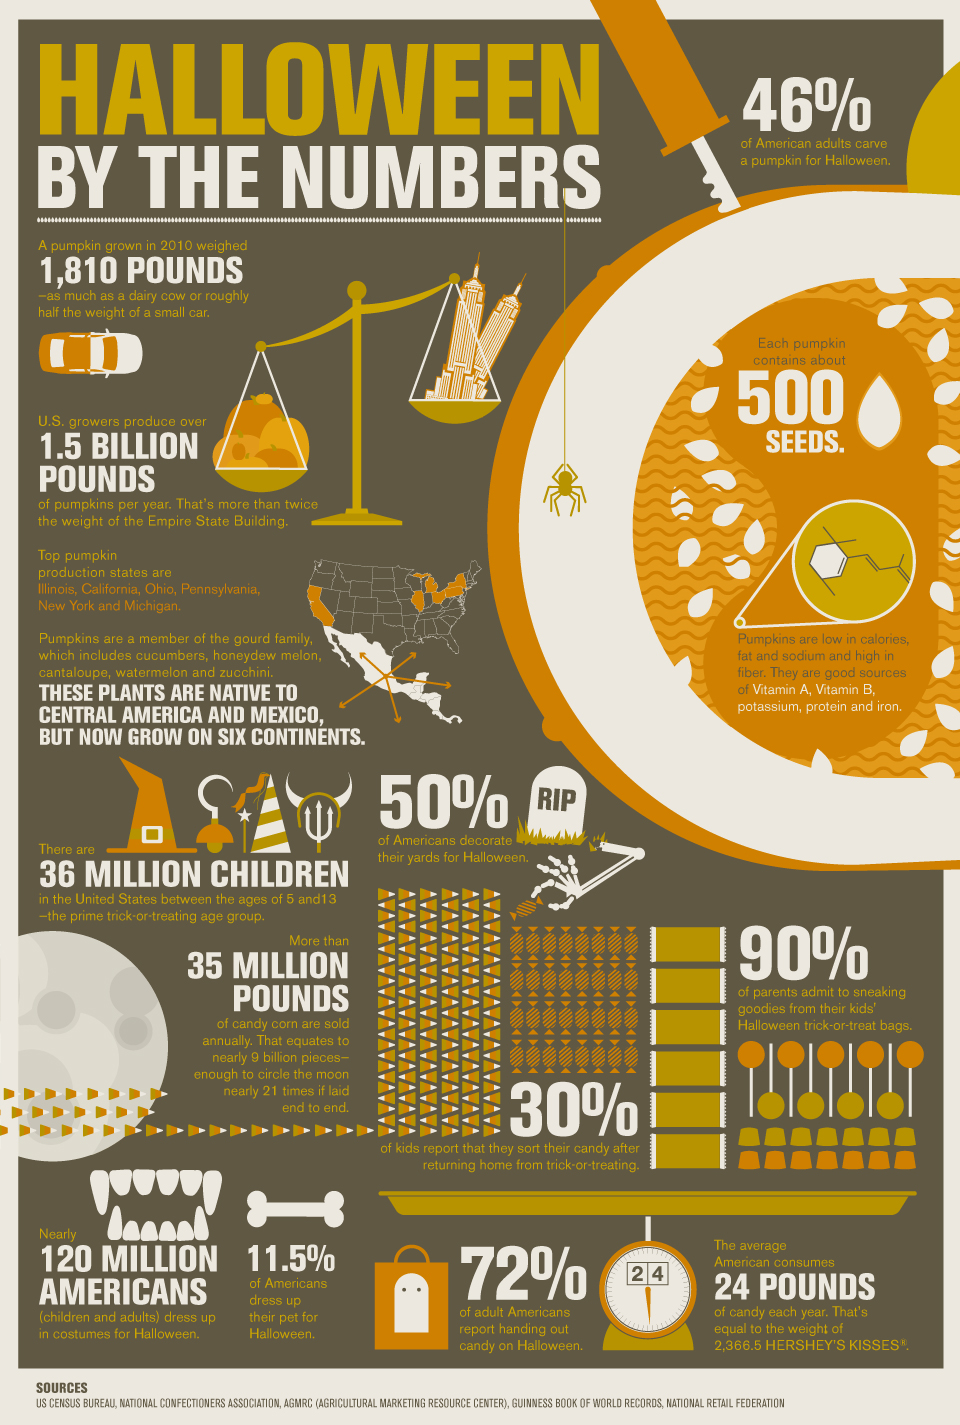
Halloween is all about celebrating monsters, ghosts, and other frightful things. This infographic introduces another scary element to the autumn holiday: math. Titled “Halloween by the Numbers,” the infographic, made by Karwoski & Courage, is based on data from History.com. It illustrates various data about Halloween by the numbers. You’ll find how many Americans carve pumpkins at Halloween, what the largest pumpkin on record weighed, and how many pumpkins are grown in the U.S. You’ll also learn about how many people decorate, how many pounds of candy are sold annually, and how many parents sneak goodies from their kids’ bags into their own. There’s also data on how many people dress up, how many hand out candy, and how much candy is eaten.

Filed Under: Holiday

Leave a Reply Cancel reply

Your email address will not be published. Required fields are marked *

Email Newsletter

  • Pinterest
  • Twitter

Fashion

The Evolution of Men’s Workwear

March 13, 2018 By Content Geek Leave a Comment

What You May Not Know About Plus Sizes

February 6, 2018 By Content Geek Leave a Comment

Ultimate ‘80s — How to Recreate Your Favorite Retro Style

January 4, 2018 By Content Geek Leave a Comment

Categories

  • Animated
  • Artist
  • Beauty
  • Business
  • Career & Jobs
  • Charity
  • Country
  • Design
  • Education
  • Entertainment Industry
  • Environmental
  • Fashion
  • Finance & Money
  • Food & Drink
  • Games
  • Health
  • Hero
  • Historical
  • Holiday
  • Home & Garden
  • Interactive
  • Internet
  • Language
  • Law and Legal
  • Lifestyle
  • Offbeat
  • Parenting
  • Pets & Animals
  • Political
  • Politics
  • Religion
  • Science
  • Shopping
  • Sports and Athletic
  • Technology
  • Time
  • Tradition
  • Transportation
  • Travel
  • Uncategorized

About Content Geek

Content Geek is devoted to sharing beautiful data. We love interesting facts, weird information, and unique visualizations. Think you have an infographic to share? Submit here for review.

Recent

  • The Plot of MacBeth Visualized
  • Top 10 Holiday Destinations
  • Deadliest Pandemics
  • How to Survive Customer Service During the Holidays

Search

Copyright © 2023 · ContentGeek.com · Log in