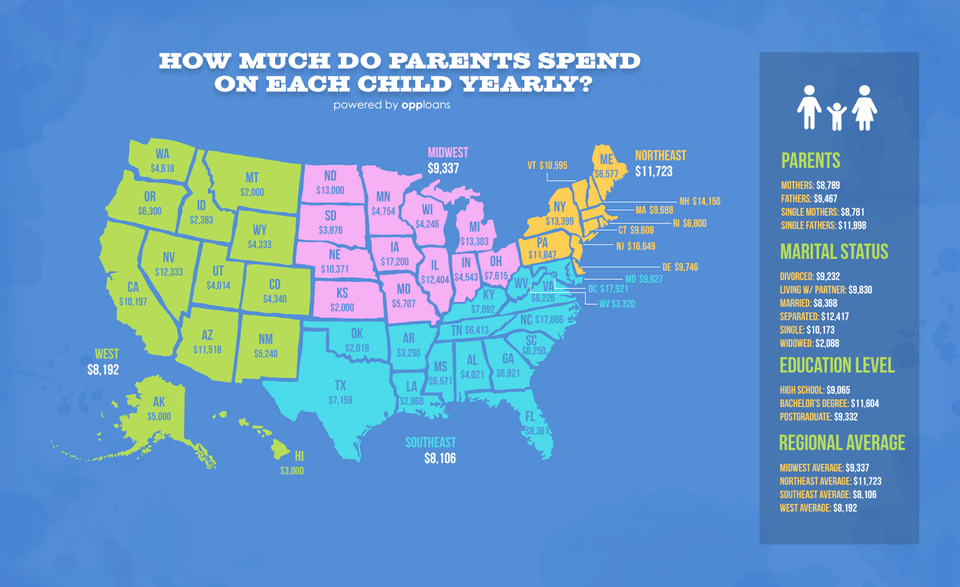
Any parent will tell you children aren’t cheap. Opp Loans Online, a website that offers installment loans, made this infographic showing how much parents spend on their children each year in the United States. Titled “How Much Do Parents Spend on Each Child Yearly?” it features a color-coded map of the U.S. Each color, green, pink, blue, and orange, correlates with a different region. The map shows the average amount of dollars parents spend on one child per year in each state. On the right-hand side, you’ll also find a key with data regarding the national average stats for parents. This includes how much single and partnered parents spend on one child annually, as well as how much parents with different marital statuses spend. In addition, you’ll find how much parents spend on average in correlation with their education level. Finally, the graphic shows the average amount spent by region.
