Content Geek

A collection of content

  • Fashion
  • Lifestyle
  • Politics
  • Technology
  • Travel
  • Submit an Infographic!

Media Bias Chart

May 22, 2018 By Content Geek Leave a Comment

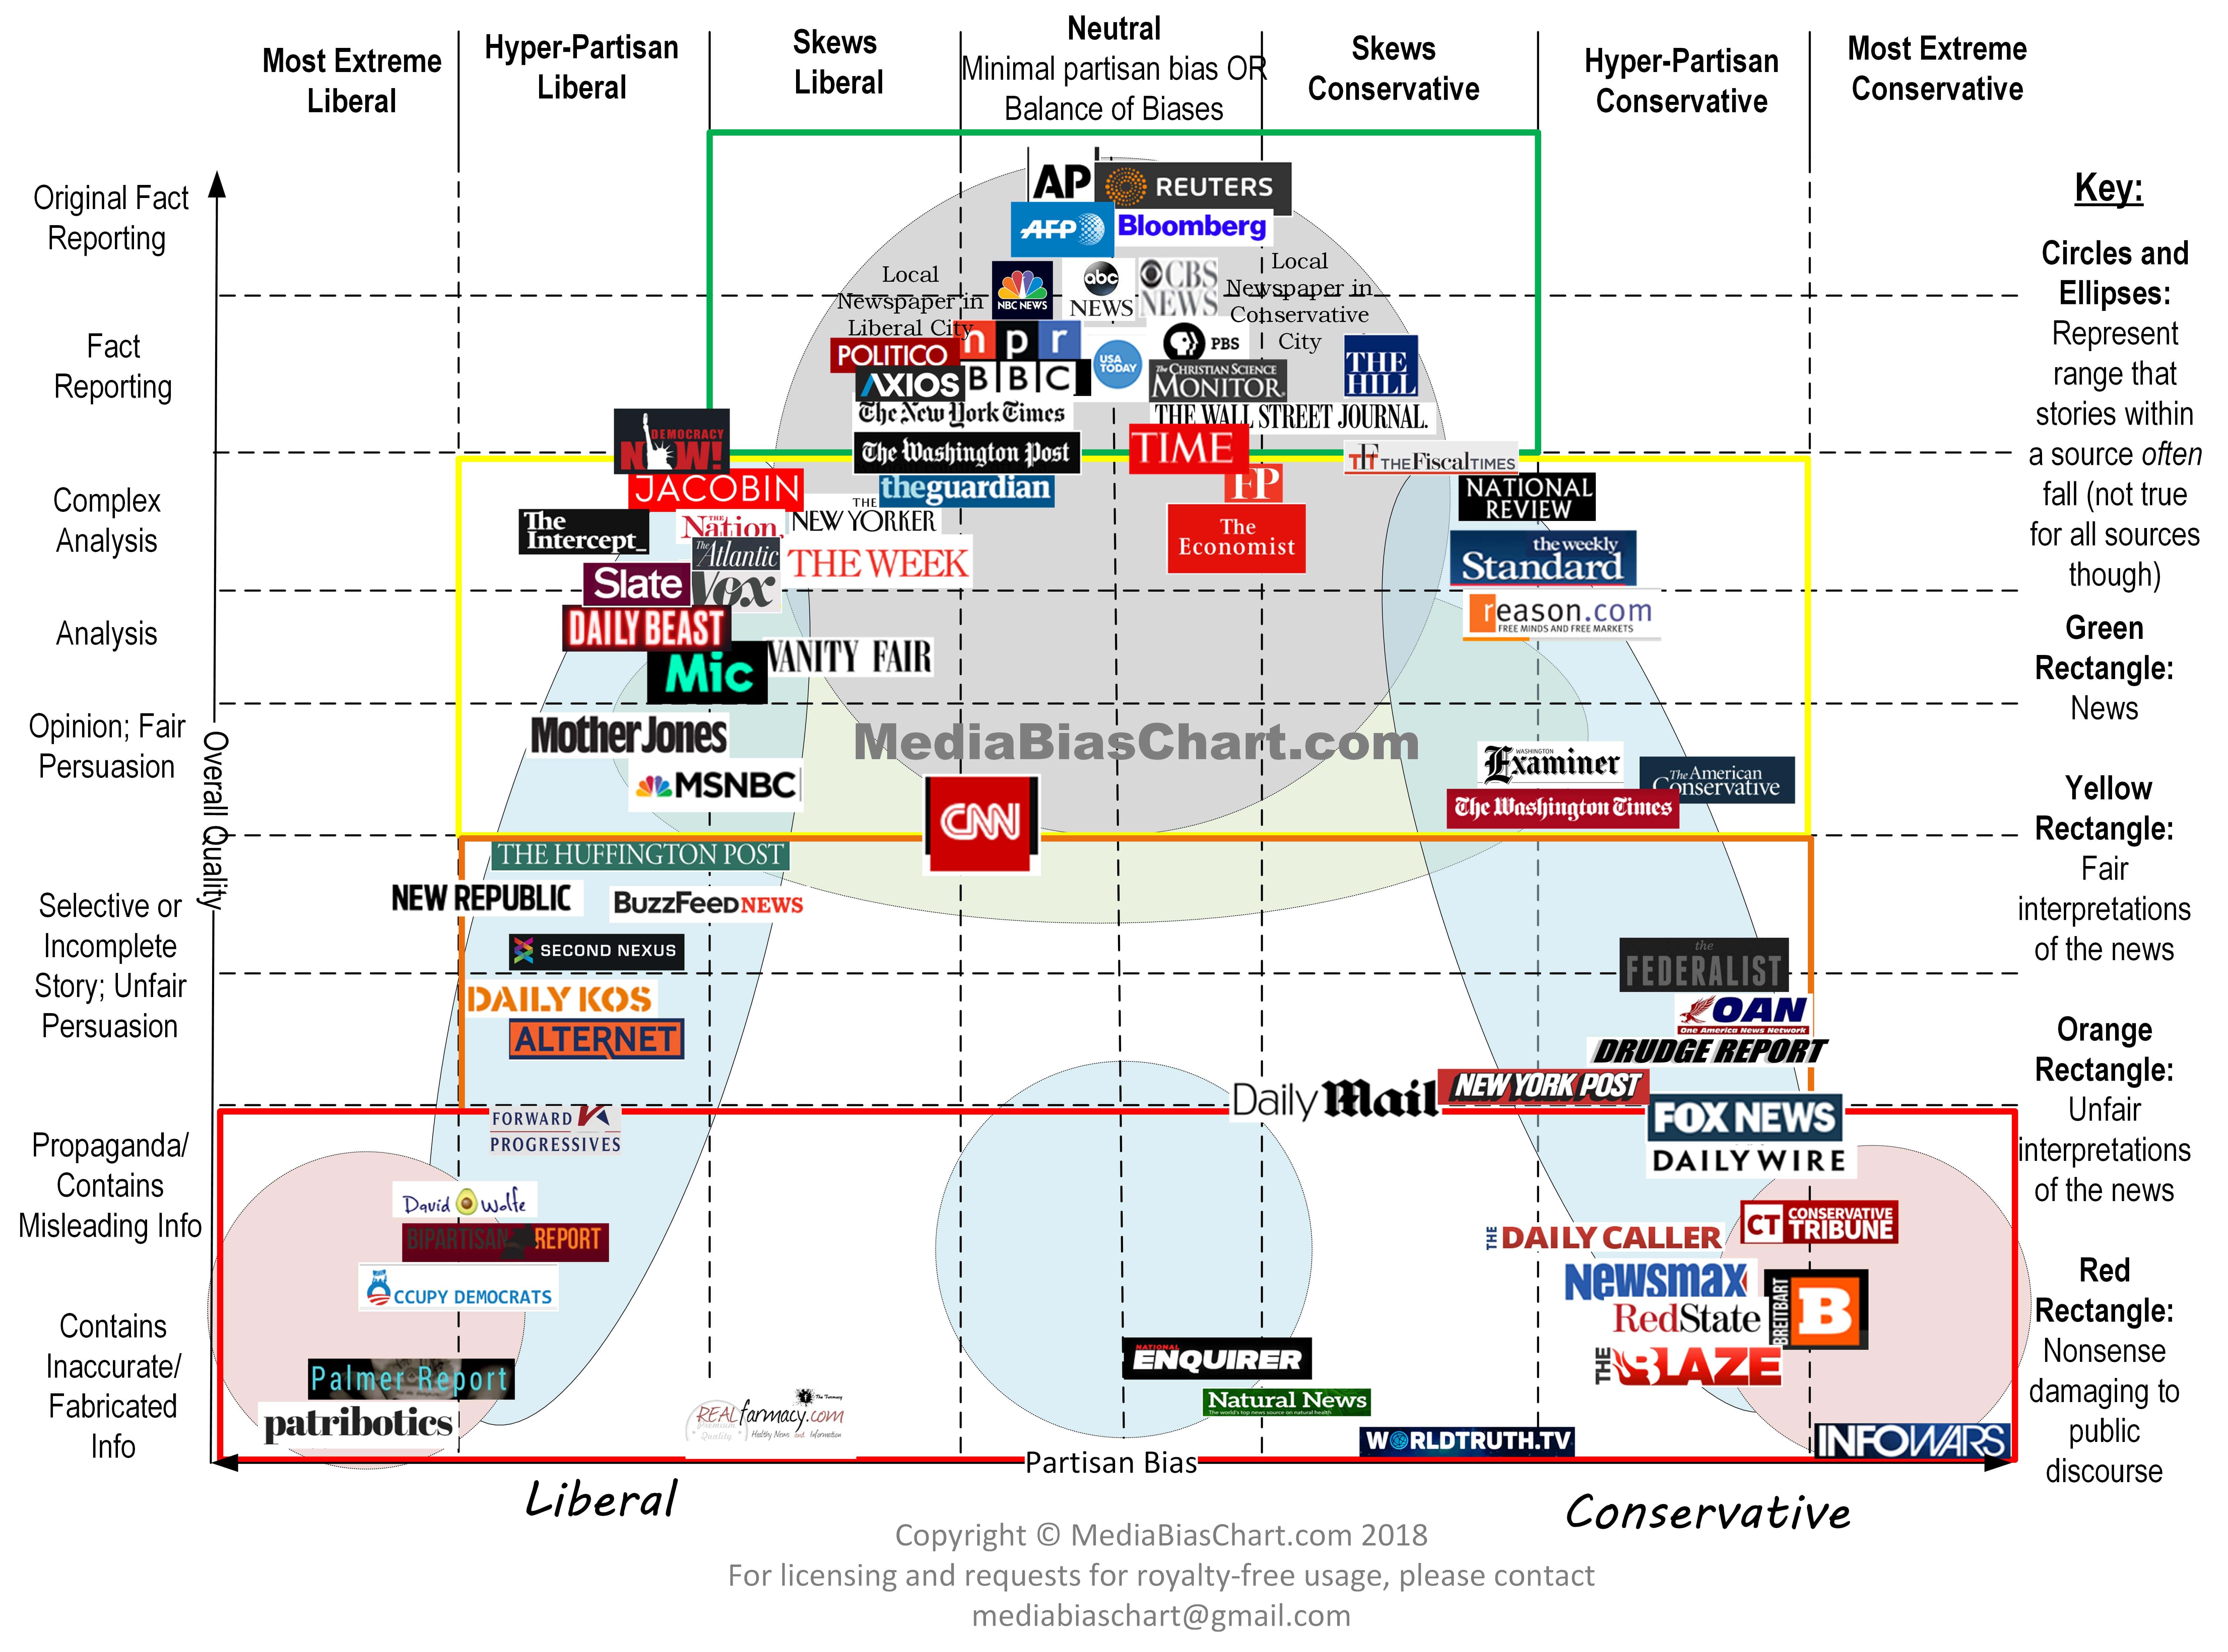
Media bias is a prevalent topic, especially when it comes to politics and political issues. The job of a journalist is to objectively seek the truth and present the facts. However, not all journalists or other news professionals subscribe to that code. There are media outlets on both sides of the political spectrum which present stories skewed to favor their political agenda. This infographic, created by Media Bias Chart mediabiaschart.com, illustrates media outlets and their perceived bias. The graph goes from far-left to far-right political affiliations on the x axis. On the y axis, you’ll find their level of bias in analysis and reporting. There is also a color code to depict which outlets offer fair and accurate interpretations of the news, and which do not.

Filed Under: Career & Jobs

Leave a Reply Cancel reply

Your email address will not be published. Required fields are marked *

Email Newsletter

  • Pinterest
  • Twitter

Fashion

The Evolution of Men’s Workwear

March 13, 2018 By Content Geek Leave a Comment

What You May Not Know About Plus Sizes

February 6, 2018 By Content Geek Leave a Comment

Ultimate ‘80s — How to Recreate Your Favorite Retro Style

January 4, 2018 By Content Geek Leave a Comment

Categories

  • Animated
  • Artist
  • Beauty
  • Business
  • Career & Jobs
  • Charity
  • Country
  • Design
  • Education
  • Entertainment Industry
  • Environmental
  • Fashion
  • Finance & Money
  • Food & Drink
  • Games
  • Health
  • Hero
  • Historical
  • Holiday
  • Home & Garden
  • Interactive
  • Internet
  • Language
  • Law and Legal
  • Lifestyle
  • Offbeat
  • Parenting
  • Pets & Animals
  • Political
  • Politics
  • Religion
  • Science
  • Shopping
  • Sports and Athletic
  • Technology
  • Time
  • Tradition
  • Transportation
  • Travel
  • Uncategorized

About Content Geek

Content Geek is devoted to sharing beautiful data. We love interesting facts, weird information, and unique visualizations. Think you have an infographic to share? Submit here for review.

Recent

  • The Plot of MacBeth Visualized
  • Top 10 Holiday Destinations
  • Deadliest Pandemics
  • How to Survive Customer Service During the Holidays

Search

Copyright © 2023 · ContentGeek.com · Log in