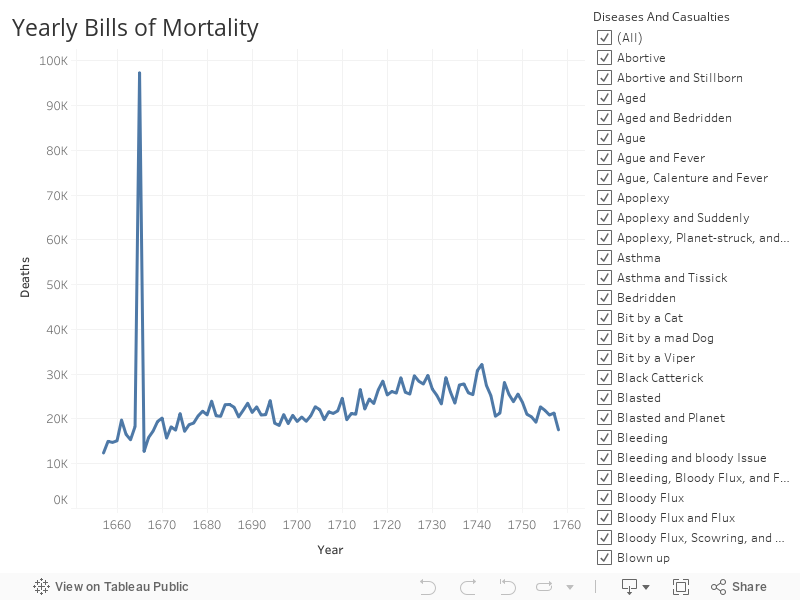
This infographic delves into a somewhat morbid but very interesting topic of mortality bills. It uses data gleaned from the Bills of Mortality, mortality statistics published in London beginning in the 17th century. Besides the number of deaths, the bills also contain information on the causes of death most common during that period. Some of the causes of death listed are quite absurd, like itch, grief, and lethargy. The graph is interactive. You can select certain causes of death and see how many people died of that ailment throughout the years. The graph, like the bills, cover the years 1657 to 1758.