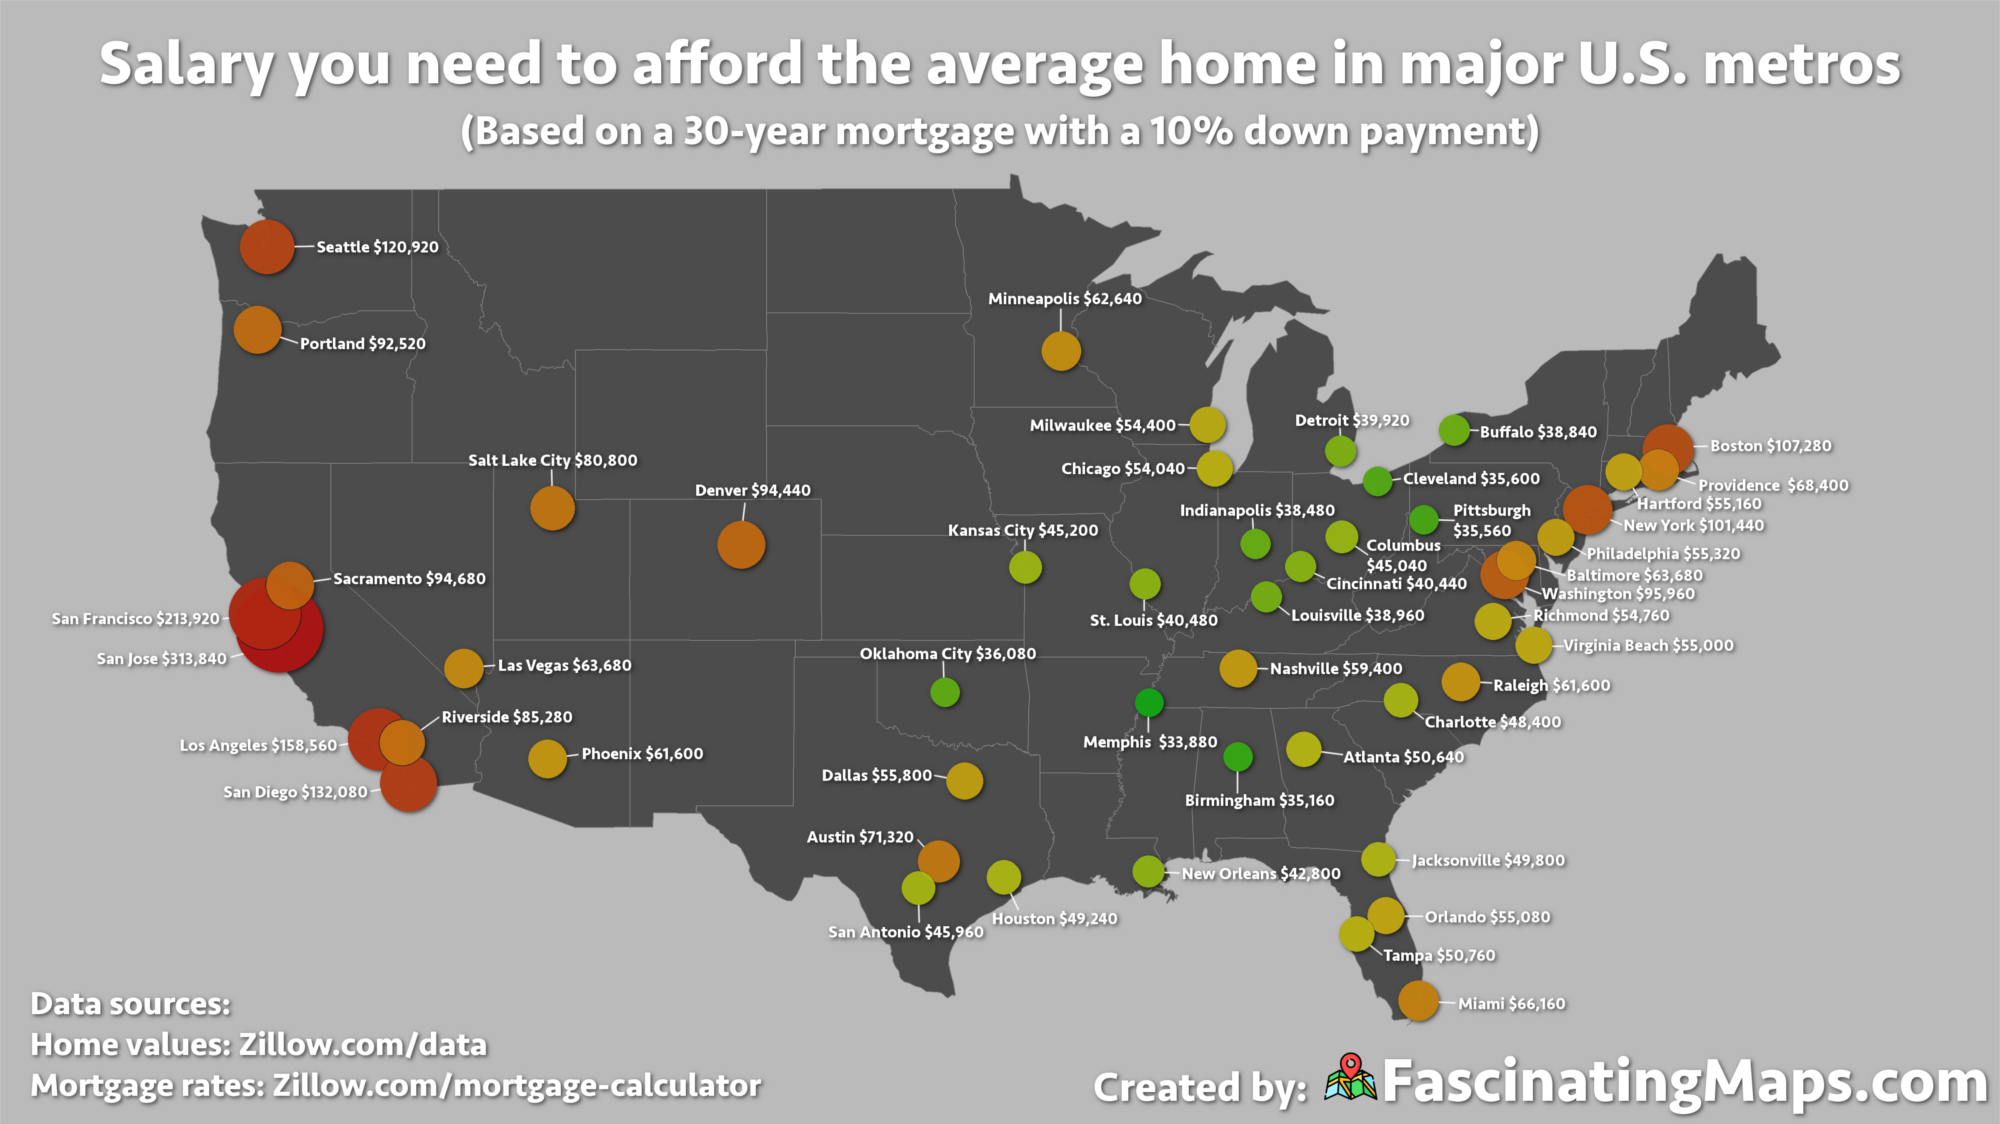
Fascinating Maps created this infographic to illustrate how much money you’d need to buy a median-priced house in different areas. Titled “Salary You Need to Afford the Average Home in Major U.S. Metros,” it consists of a map of the United States with various metro areas pinpointed. The data, collected from the real estate site Zillow, is based on a 30-year mortgage with a 10% down payment, which is generally the minimum amount to secure a loan. The map is color-coded to depict which areas are most expensive. It also states the average price next to the city name.