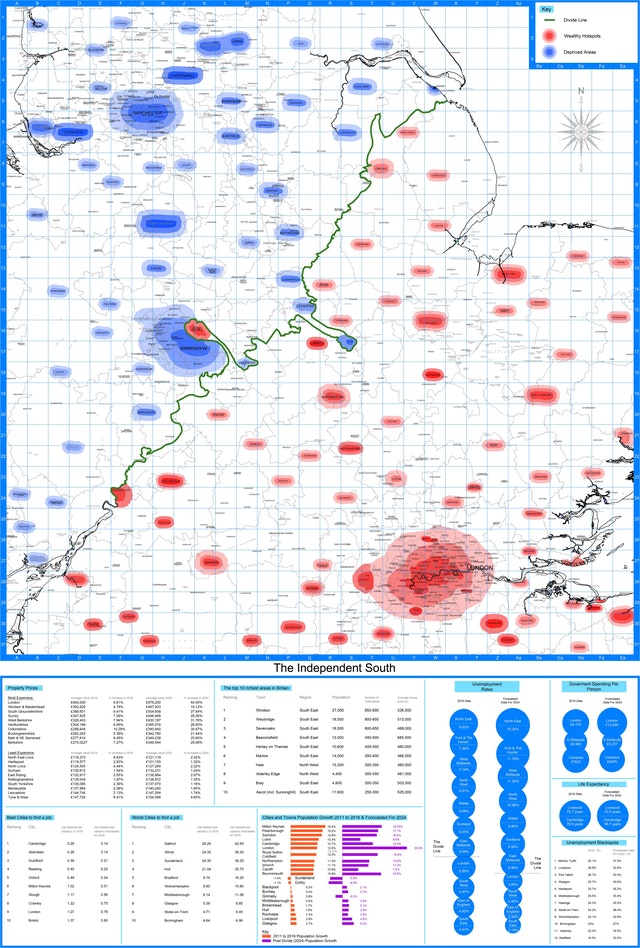
Great Britain is divided into the north and sound with a definitive line, similar in a sense to the Mason-Dixon line that lies between the north and south United States. In Britain, the line runs between Grimsby in the north and Gloucester in the south. A Reddit user made this infographic titled “The Great British Divide” to illustrate the separation between the two regions. The map shows the government spending per person, life expectancy, property prices, wealthiest towns, unemployment blackspots, and the best and worst cities in which to find a job. The core data dates back to 2016 and the forecast data goes to 2024 based on recent trends. As the creator explains, in the wake of Brexit, the divide will get larger if things continue as they are.
