
When you think of spring break, chances are you think of bronzed and brawny college students dancing and drinking the days away in a sunny paradise like Miami or Cancun. The modern-day spring break is synonymous with 20-somethings letting loose and having more fun than their parents would care to know about. But the week-long holiday didn’t start out that way. The first spring … [Read more...]
Archives for May 2017
The True Cost of a Wedding
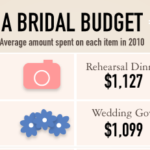
Weddings are beautiful, ceremonious events full of love, joy, and unity. They’re also downright expensive. From the wedding dress to the ring, the flowers to the venue rental, weddings can easily cost thousands of dollars, even for more frugal couples. This infographic illustrates the true cost of weddings in the United States. It outlines data like the average number of … [Read more...]
Mortality Bills, 17th and 18th Century England

This infographic delves into a somewhat morbid but very interesting topic of mortality bills. It uses data gleaned from the Bills of Mortality, mortality statistics published in London beginning in the 17th century. Besides the number of deaths, the bills also contain information on the causes of death most common during that period. Some of the causes of death listed are quite … [Read more...]
A Brief History of Weddings

From honeymoons to rings, marriage and weddings are steeped in tradition. This infographic outlines the history of weddings, dating all the way back to 3,000 BCE. According to the infographic, the first weddings recorded occurred 4,350 years ago, before which time families were comprised of as many as 30 people. As the illustration shows, some ancient traditions have continued … [Read more...]
The World Connected by Food

If there’s anything that can bring people together, it’s food. This infographic proves that by demonstrating how different countries around the globe share common foods. The visualization was compiled from a crowdsourced dataset published on Kaggle. The chart shows the percentage of shared food between two countries on y and x axes. For example, New Zealand, on the y-axis, … [Read more...]