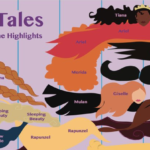
This fun and whimsical infographic was created by The Mane Highlights. Several Disney princesses are pictured on the graph. Their long manes represent the line going along the x axis. On the x axis are several different traits and fates. These include: falling into a deep sleep; put under a spell; captured; ran away; was transformed; had a forbidden love; and saved the day. The … [Read more...]
Archives for January 2018
Which States Eat the Most Ice Cream
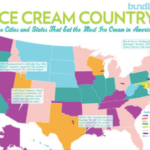
Bundle made this infographic entitled “Ice Cream Country” which illustrates the cities and states that consume the most ice cream. The graphic depicts a colorful map of the United States. Each state is a different color, symbolizing the percentage of ice cream consumption per capita. The number is compared to the national average. The infographic also shows where big ice cream … [Read more...]
How Couples Spend Their Time Apart and Together
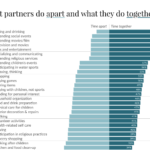
This infographic illustrates what couples do when alone vs. what they do with their partner. The graphic is based on data from the American Time Use Survey. At the top of the graphic, you’ll find activities couples most often do together. For example, 81% of respondents said they eat and drink together; 75% said they attend social events together; and 73% said they go to movies … [Read more...]
#Adulting: Who to Call When Something Breaks
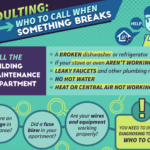
As a renter, you’ll be glad to know that the property manager is responsible for many apartment repairs. In fact, it’s typical for them to budget 1.5% of the property’s total value for repairs, so don’t hesitate to ask for repairs when you need it. … [Read more...]
What Happens When You Have an Energy Drink
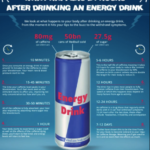
Does Red Bull really give you wings? Personalise.co.uk, a personalized gift shop, produced this infographic illustrating what happens to your body after drinking an energy drink. The energy drink used in this example is a 250 ml can of Redbull. The graphic explains that 10 minutes after consumption, the caffeine enters your bloodstream. Next, it explains what happens at 15-45 … [Read more...]