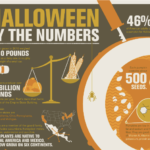
Halloween is all about celebrating monsters, ghosts, and other frightful things. This infographic introduces another scary element to the autumn holiday: math. Titled “Halloween by the Numbers,” the infographic, made by Karwoski & Courage, is based on data from History.com. It illustrates various data about Halloween by the numbers. You’ll find how many Americans carve pumpkins … [Read more...]
Christmas Around the World

Like New Years, Christmas is celebrated in many parts of the world from the South Pacific to Europe. This infographic titled “Christmas in the World” shares information about how different cultures observe the holiday. Created by travel website Venere.com, the left-hand side consists of information on Christmas cuisine while the right-hand side consists of fun facts. In the … [Read more...]
Wine for Beginners
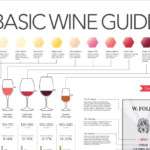
If ordering wine in a restaurant makes you nervous, you’re not alone. Many people don’t know a lot about wine other than it tastes good and provides a pleasant buzz (or more, depending on what you’re after). Wine Folly, an educational website directed at people who want to learn about wine, made this infographic titled “Basic Wine Guide.” As the name suggests, it provides an … [Read more...]
Fun Facts About the Spanish Language

Whether you’ve been studying Spanish for years or want to learn more about the language, this infographic may interest you. Titled “11 Fun Facts About the Spanish Language,” the colorful infographic shares 11 things to know about the world’s second-most widely spoken language. Facts include how many countries have Spanish as an official language, as well as how many people … [Read more...]
Salary You Need to Afford a Median-Priced Home in the U.S.
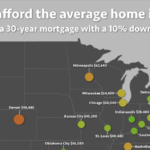
Fascinating Maps created this infographic to illustrate how much money you’d need to buy a median-priced house in different areas. Titled “Salary You Need to Afford the Average Home in Major U.S. Metros,” it consists of a map of the United States with various metro areas pinpointed. The data, collected from the real estate site Zillow, is based on a 30-year mortgage with a 10% … [Read more...]